Europe › Switzerland › Thun › Climate

Thun climate data

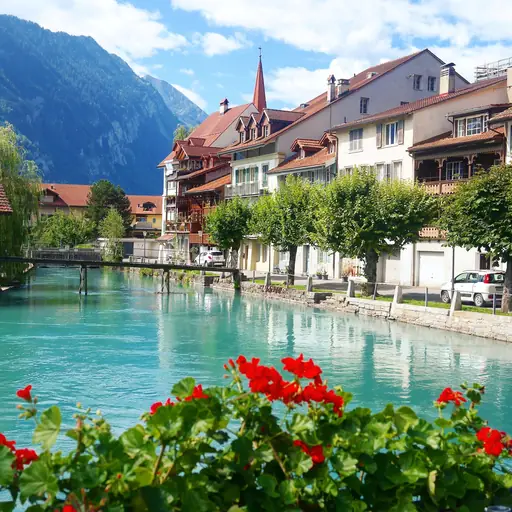
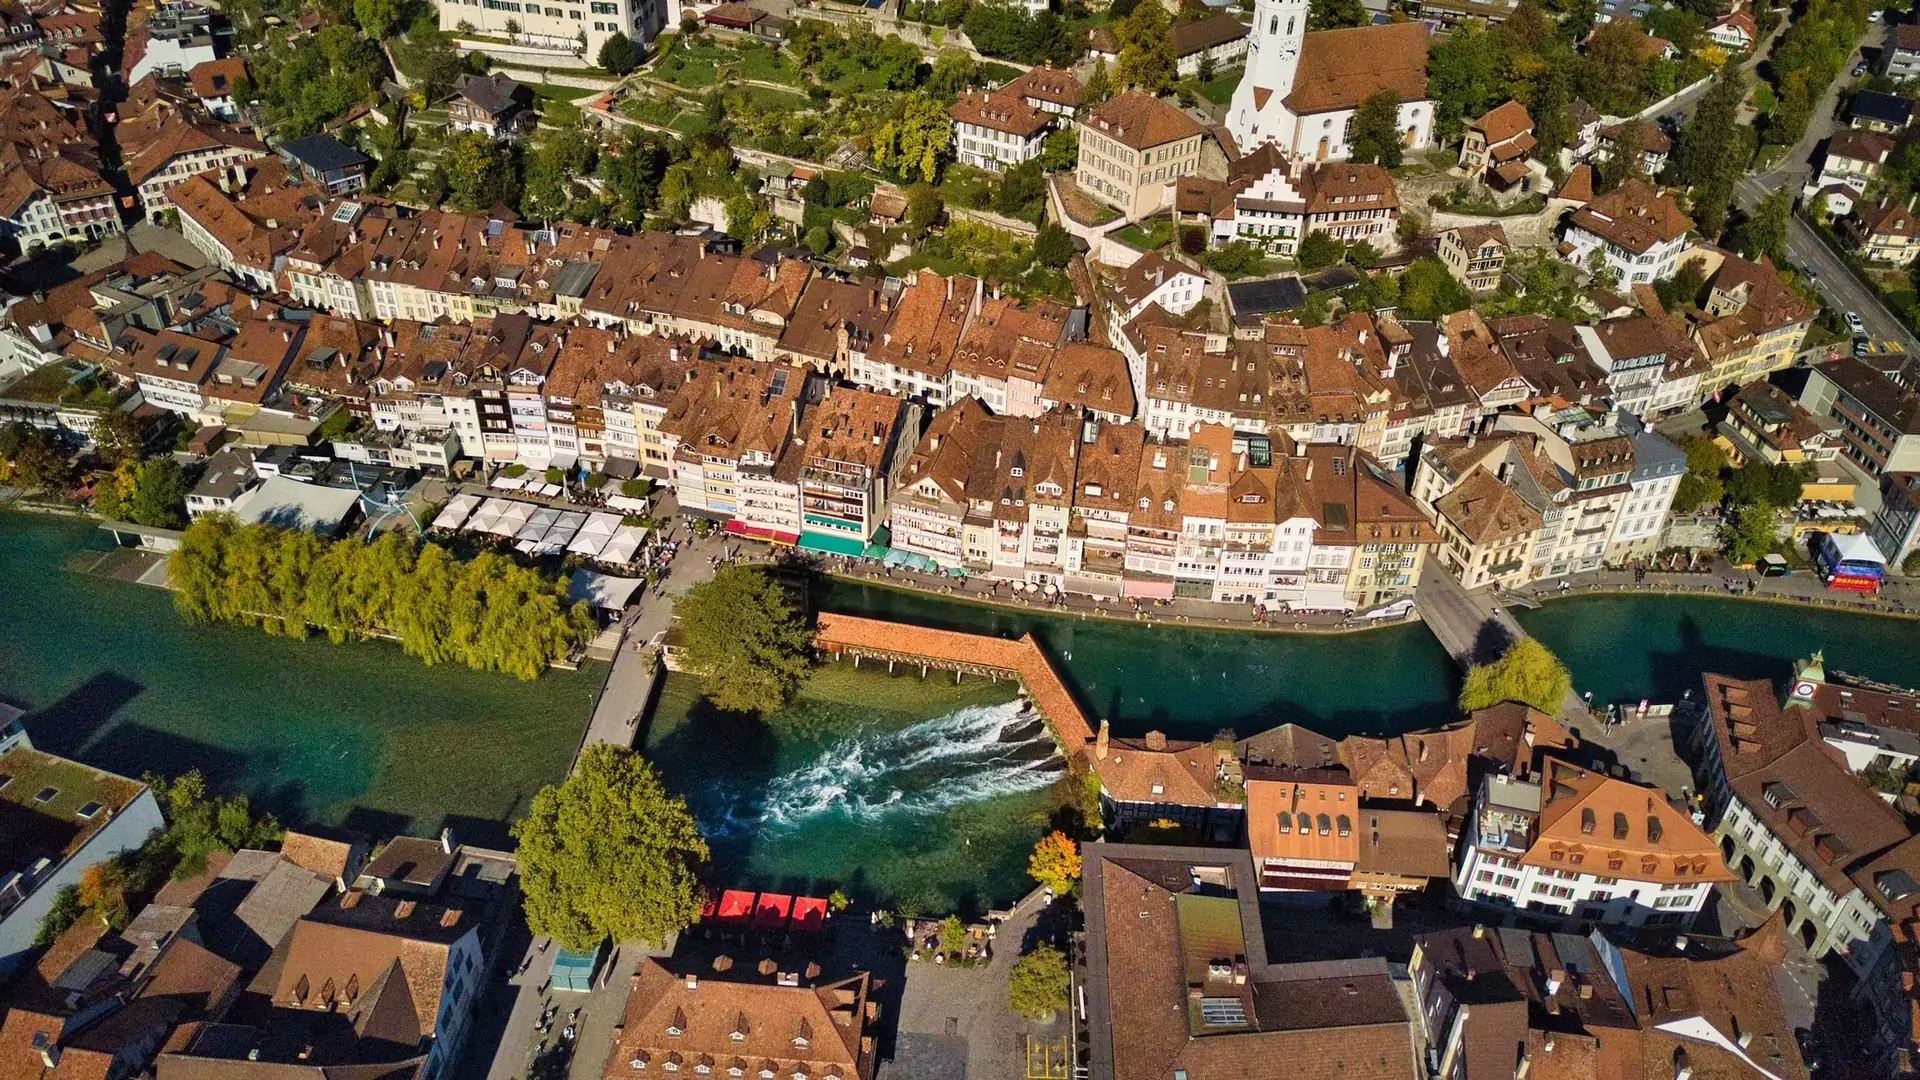
Thun, nestled on the edge of the Bernese Alps and Lake Thun, features a temperate climate with warm, wet summers and cold, snowy winters. The city experiences significant seasonal contrasts, moderate rainfall year-round, and frequent cloud cover. With long daylight hours in summer and picturesque alpine scenery, Thun is a captivating destination for outdoor adventure and relaxation.

Best times to travel

The best times to travel section shows how the months compare for a visit, so you can find the time of year that fits what you want to do.

Background colours of the months:
The colour shows the typical temperature: yellow (hot), green (mild) and blue (cold). How strong the colour is shows the travel season: full colour means high season, soft colour means shoulder season and soft-striped means off season.

Weather symbols:
Each month has one symbol showing what the weather is typically like, such as hot and sunny, freezing or a rainy or snowy season. Use them to quickly spot months that match the weather you want, or to avoid the ones that don't.

Crowdedness:
The people icon shows how busy the place usually is. The more people, the more crowded it gets.

Additional notes:
The grey info boxes point out special things worth knowing, like recurring weather issues or seasonal events.

for Thun, Switzerland
🌨️
Jan
🌨️
Feb
🌤️
Mar
🌤️
Apr
🌦️
May
🌦️
Jun
🌦️
Jul
🌦️
Aug
🌤️
Sep
🌤️
Oct
🌤️
Nov
🌨️
Dec
High season: June - Sep.
Shoulder season: April - May, Oct.
Crowdedness: 6 (Many tourists)
Tap on a month for more info Hover over a month for more info
Lake Thun boats run a full schedule roughly May to October, reduced service in winter
Nearby Bernese Oberland: skiing December to April, hiking June to October

The climate of Thun

Thun’s climate is shaped by its alpine surroundings and lake influence, resulting in four distinct seasons and moderate temperature swings. Summers (June–August) are comfortable and wet, with average highs of 23–25°C and lows of 12–14°C. July is the warmest month, offering up to 15 hours of daylight and around 11–14 hours of sunshine. Rain is frequent, with June and August each receiving about 130–138 mm over 12–13 days, often as afternoon or evening showers. Humidity is moderate, and gentle breezes from the lake keep the air fresh. The lake’s water warms to around 20°C by August, making swimming possible for hardy visitors.

Winters (December–February) are cold and snowy, with average highs of 4–6°C and lows of -2 to 0°C. January is the coldest month, and snow is common, especially in the surrounding hills and mountains, though less frequent in town. Rain and snow are evenly distributed, with February being the driest month (about 46 mm over 8 days). Days are short, with only 8–9 hours of daylight and 1–2 hours of sunshine. Spring (March–May) and autumn (September–November) are transitional, with mild to cool temperatures (10–18°C), frequent showers, and vibrant seasonal colours. Winds are generally light to moderate (10–15 km/h), but can be brisk during storms. Thun receives about 1,000–1,050 mm of precipitation annually and enjoys 1,700–1,900 hours of sunshine per year, supporting lush greenery and alpine vistas.

Average climate data for Thun, Switzerland
Month Jan Feb Mar Apr May Jun Jul Aug Sep Oct Nov Dec Year
Average maximum temperature (°C) 1 1 5 10 13 18 20 20 16 11 6 2 20
Average minimum temperature (°C) -7 -7 -4 0 3 7 9 9 6 3 -1 -5 -7
Average precipitation (mm) 77 65 67 63 115 113 115 108 53 68 79 94 1,018
Average rainfall days (days) 14 12 16 18 22 21 21 19 16 14 12 13 197
Average snowfall (mm) 190 204 139 48 6 0 0 0 0 9 98 206 901
Average snowfall days (days) 12 11 7 2 0 0 0 0 0 1 5 8 44
Average relative humidity (%) 86 88 86 82 81 80 79 80 81 81 84 83 83
Average wind speed (km/h) 8 8 8 7 7 7 6 6 6 7 7 8 7
Average daily daylight hours (h) 9 10 11 13 15 15 15 14 12 10 9 8 12
Average daily sunshine hours (h) 5 5 6 8 9 9 10 10 8 6 5 5 7
Average cloud coverage (%) 46 48 45 41 46 42 38 35 37 35 41 44 42
Average UV index 2 2 2 3 3 4 4 4 3 2 2 2 3

Travel info

  • Spring (March–May): Cool to mild, with highs from 10–18°C. Frequent showers and blooming landscapes. Ideal for hiking and city walks – bring layers and a rain jacket.
  • Summer (June–August): Warm, wet, and lively, with highs of 23–25°C. Occasional thunderstorms, long daylight hours, and lake swimming – pack sun protection, light clothing, and a jumper for cool evenings.
  • Autumn (September–November): Pleasant in September (up to 18°C), cooling to 8°C by November. Rainfall increases, and days shorten. Early autumn is great for hiking and fewer tourists – bring layers and rain gear.
  • Winter (December–February): Cold and snowy, with highs of 4–6°C and lows near -2°C. Frequent snow, especially in the hills, and short days. Dress warmly and bring waterproof boots. Enjoy Christmas markets and alpine scenery.
  • General tips: Weather is unpredictable – always dress in layers and carry rain gear. Even in summer, evenings can be cool. Book early for summer lake activities and winter ski trips. Winds can be brisk, especially during storms. Daylight hours vary greatly by season.

The best time to visit Thun

The best time to visit Thun is from June to September, when temperatures are warmest (20–25°C), days are longest, and the city is vibrant with lake activities, hiking, and outdoor festivals. These months offer ideal conditions for swimming, sightseeing, and exploring the Bernese Oberland, with lush landscapes and lively local events.

The worst time to visit Thun

The least favourable time to visit Thun is from December to February, when temperatures are lowest, days are shortest, and frequent snow or rain can limit outdoor activities. While winter is atmospheric and offers access to nearby ski resorts, the cold, damp, and sometimes cloudy conditions may not appeal to all travellers.

Frequently asked questions

What is the climate like in Thun year-round?

Thun has a temperate climate with warm, wet summers and cold, snowy winters. Rain and snow fall year-round, with peaks in summer and late autumn. Summers are lively, while winters are atmospheric and often snowy.

When is the best time to visit Thun?

The best time to visit Thun is from June to September, when the weather is warm, days are long, and the city is lively with lake activities, hiking, and outdoor events. Early autumn is also pleasant for sightseeing.

Does it snow in Thun?

Yes, snow is common in Thun from December to February, especially in the surrounding hills and mountains. In town, snowfalls are lighter and less frequent but still possible during cold spells.

How much does it rain in Thun?

Thun receives about 1,000–1,050 mm of precipitation annually. Rain falls throughout the year, with the wettest months in June, July, and August. Showers are frequent but often brief, especially in summer.

How hot does it get in Thun during summer?

Summer highs in Thun typically reach 23–25°C, with July and August being the warmest months. Heatwaves above 30°C are rare, and evenings are usually cool and comfortable for outdoor activities.

Is the lake warm enough for swimming in Thun?

Lake Thun reaches about 20°C in August, making swimming possible for hardy visitors. The water is cooler in June and September, and cold the rest of the year.

What should I pack for a trip to Thun?

Pack layers for cool mornings and evenings, a rain jacket for showers, and sun protection for summer. In winter, bring warm clothing, a hat, gloves, and waterproof shoes for cold, wet, or snowy conditions.

Minimum and maximum temperatures in Thun

The warmest month, with the highest average maximum temperature, is July (20 °C). The month with the lowest average maximum temperature is January (0.8 °C). Overall, the average maximum temperature over the whole year is 10.3 °C.

The month with the highest average minimum temperature is July (9.2 °C). The coldest month, with the lowest average minimum temperature, is February (-7 °C). Overall, the average minimum temperature over the whole year is 1.2 °C.

Rainfall amount in Thun

The wettest month, with the highest amount of precipitation, is May (115.3 mm). The driest month, with the least amount of precipitation, is September (53.2 mm). Over the whole year there are 1,018.1 mm of rainfall on average.

Rainfall days in Thun

The month with the most days of rain is May (21.8 days). The month with the fewest days of rain is February (11.7 days). Over the whole year there are 197 days of rain on average.

Snowfall amount in Thun

The month with the most snowfall is December (206.2 mm). The months with the least snowfall are June, July, August and September (0 mm). Over the whole year there are 900.6 mm of snowfall on average.

Snowfall days in Thun

The month with the most days of snowfall is January (11.8 days). The months with the fewest days of snowfall are August and September (0 days). Over the whole year there are 44.1 days of snowfall on average.

Relative humidity in Thun

The month with the highest average relative humidity is February (88.3 %). The month with the lowest average relative humidity is July (78.8 %). The overall average relative humidity over the whole year is 82.6 %.

Wind speed in Thun

The windiest month, with the highest average wind speed, is December (8.3 km/h). The calmest month, with the lowest average wind speed, is August (6 km/h). The overall average wind speed over the whole year is 7.2 km/h.

Cloud coverage in Thun

The month with the cloudiest skies, so the highest cloud coverage, is February (48 %). The month with the clearest skies, so the lowest cloud coverage, is August (35.1 %). Over the whole year there is an average cloud coverage of 41.6 %.

Daylight hours and sunshine hours in Thun

The month with the longest days, so the most daylight, is June (Average daylight: 15.1 h). The month with the shortest days, so the least daylight, is December (Average daylight: 8.1 h). Over the whole year there are 11.8 h of daylight per day on average.

The month with the most sunshine per day is August (Average sunshine: 10 h). The month with the least sunshine per day is December (Average sunshine: 4.9 h). Over the whole year there are 7.2 h of sunlight per day on average.

UV index in Thun

The months with the highest average UV index are June, July and August (UV index: 4). The months with the lowest average UV index are January, February, March, October, November and December (UV index: 2). Over the whole year the average UV index is 2.8.

Was this page helpful?
Feedback