Europe › Croatia › Istria › Pula › Climate

Pula climate data

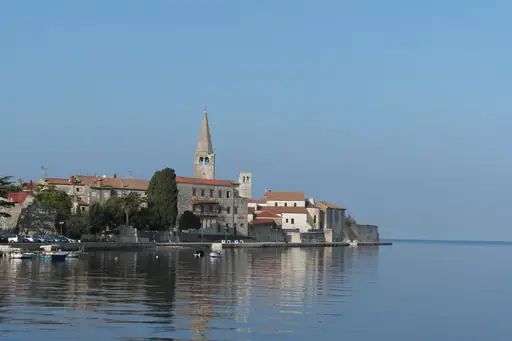
Pula, on Croatia’s Istrian Peninsula, enjoys a classic Mediterranean climate with hot, sunny summers and mild, wetter winters. The city experiences abundant sunshine, moderate humidity, and sea breezes, making it a favourite for beach holidays and outdoor exploration. Spring and autumn are especially pleasant, offering comfortable weather and fewer crowds for sightseeing.

Best times to travel

The best times to travel section shows how the months compare for a visit, so you can find the time of year that fits what you want to do.

Background colours of the months:
The colour shows the typical temperature: yellow (hot), green (mild) and blue (cold). How strong the colour is shows the travel season: full colour means high season, soft colour means shoulder season and soft-striped means off season.

Weather symbols:
Each month has one symbol showing what the weather is typically like, such as hot and sunny, freezing or a rainy or snowy season. Use them to quickly spot months that match the weather you want, or to avoid the ones that don't.

Crowdedness:
The people icon shows how busy the place usually is. The more people, the more crowded it gets.

Additional notes:
The grey info boxes point out special things worth knowing, like recurring weather issues or seasonal events.

for Pula, Croatia
🌥️
Jan
🌤️
Feb
🌤️
Mar
🌤️
Apr
☀️
May
☀️
Jun
🔥
Jul
🔥
Aug
☀️
Sep
🌤️
Oct
🌥️
Nov
🌦️
Dec
High season: June - Sep.
Shoulder season: April - May, Oct.
Crowdedness: 7 (Many tourists)
Tap on a month for more info Hover over a month for more info
Many hotels, campsites, beach bars and boat trips close October to April
Pula Film Festival in the Roman Arena, mid July, plus summer concerts in the amphitheatre
Bora wind in winter can bring strong gusts and occasional ferry cancellations

The climate of Pula

Pula’s climate is shaped by its coastal location on the Adriatic Sea. Summers (June–August) are hot, dry, and sunny, with average highs of 28–30°C and lows around 18–20°C. July and August are the warmest and sunniest months, often reaching up to 29°C, with sea temperatures peaking at 25–25.5°C – perfect for swimming and water sports. Rain is infrequent in summer, with July seeing as little as 35–55 mm over 4–6 days, though brief thunderstorms can occur. The maestral wind provides a refreshing afternoon breeze, while UV levels are very high, so sun protection is essential. Days are long, offering up to 13 hours of sunshine and over 15 hours of daylight at the solstice.

Winters (December–February) are mild and wetter, with highs of 9–13°C and lows of 3–6°C. January is the coldest month, averaging 5–7°C, and while snow is rare, frosts can occur. Rainfall is highest from October to January, with November being the wettest month (80–110 mm). Winter days are short, with 3–4 hours of sunshine. Spring (March–May) and autumn (September–November) are transitional, with spring warming from 13°C in March to 22°C in May, and autumn cooling from 25°C in September to 14°C in November. Rain is moderate in these seasons, and the sea remains swimmable into early autumn. Winds are variable: the bura brings cool, clear air in winter, the jugo brings rain in autumn, and the maestral brings pleasant breezes in summer. Pula enjoys about 2,200–2,400 hours of sunshine annually and receives 800–1,064 mm of rain per year.

Average climate data for Pula, Croatia
Month Jan Feb Mar Apr May Jun Jul Aug Sep Oct Nov Dec Year
Average maximum temperature (°C) 10 10 13 16 21 25 28 28 24 20 14 10 28
Average minimum temperature (°C) 2 2 4 8 12 16 18 18 15 12 7 4 2
Average precipitation (mm) 78 63 65 70 55 54 47 76 85 84 80 113 871
Average rainfall days (days) 12 12 12 13 13 13 10 11 11 12 13 13 145
Average water temperature (°C) 11 10 11 14 18 23 25 25 24 20 17 14 18
Average daily daylight hours (h) 9 10 11 13 14 15 15 14 12 11 9 8 12
Average daily sunshine hours (h) 3 4 5 6 8 9 10 9 7 5 3 3 6
Average UV index 1 2 3 5 7 8 8 7 5 3 2 1 4

Travel info

  • Spring (March–May): Mild and increasingly sunny, with highs from 13°C to 22°C. Occasional rain showers and blooming nature – ideal for sightseeing and hiking. Pack layers and a rain jacket.
  • Summer (June–August): Hot, dry, and sunny, with highs of 28–30°C. Sea temperatures reach 25°C. Perfect for beaches, festivals, and water sports – bring sun protection and swimwear.
  • Autumn (September–November): Warm in September (up to 25°C), cooling to 14°C by November. Rainfall increases in October and November. Early autumn is great for swimming and wine tours – layered clothing and waterproof gear recommended.
  • Winter (December–February): Mild but wetter, with highs of 9–13°C and lows of 3–6°C. Rain and occasional frosts are possible. Warm, waterproof clothing is essential.
  • Travel Tips: Pula’s weather is changeable – always pack layers and rain gear. Summer is best for beaches and nightlife, while spring and autumn offer comfortable sightseeing. Winter is quiet but atmospheric, with local festivals and cosy cafés.

The best time to visit Pula

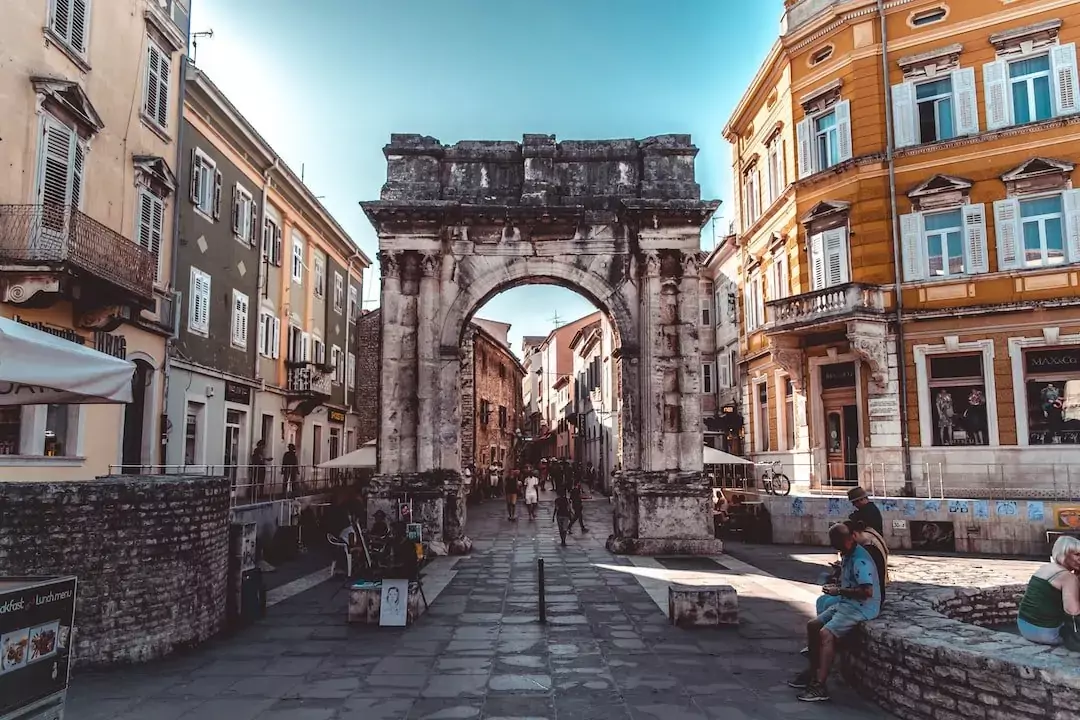
The best time to visit Pula is from late May to September, when temperatures are warm (22–30°C), rainfall is low, and the sea is perfect for swimming. June and September are especially pleasant, with fewer crowds and ideal conditions for both beach activities and exploring the city’s Roman heritage.

The worst time to visit Pula

The least favourable time is from November to February, when Pula is at its wettest and coolest. Rain is frequent, days are shorter, and while winters are mild, outdoor activities can be limited by wet and windy conditions, though the city’s historic sites and cafés remain inviting.

Frequently asked questions

What is the climate like in Pula year-round?

Pula has a Mediterranean climate with hot, dry summers (28–30°C), mild, wetter winters (9–13°C), and abundant sunshine. Rain falls mostly in autumn and winter, while summers are sunny and dry.

When is the best time to visit Pula?

The best time to visit Pula is from late May to September, especially June and September, when the weather is warm, rainfall is low, and the sea is ideal for swimming and water sports.

Does it snow in Pula?

Snow is very rare in Pula, but frosts can occur in winter. Most winter precipitation falls as rain, and cold spells are short-lived due to the moderating influence of the Adriatic Sea.

How much rain does Pula get?

Pula receives about 800–1,064 mm of precipitation annually, with the wettest months from October to January. Summer is much drier, with July and August seeing minimal rainfall.

How warm is the sea in Pula?

Sea temperatures in Pula range from 11°C in winter to 25–25.5°C in August. The best months for swimming are June to September, when the water is warmest and most inviting.

Is Pula windy?

Yes, Pula experiences various winds: the maestral brings cool breezes in summer, the jugo brings rain in autumn, and the bura brings cold, clear air in winter. Winds are generally pleasant but can be strong during storms.

What should I pack for Pula?

Pack light, breathable clothing and sun protection for summer. In spring and autumn, bring layers and a rain jacket. For winter, warm, waterproof clothing is essential due to rain and occasional frost.

Minimum and maximum temperatures in Pula

The warmest month, with the highest average maximum temperature, is August (28.1 °C). The month with the lowest average maximum temperature is December (10 °C). Overall, the average maximum temperature over the whole year is 18.3 °C.

The month with the highest average minimum temperature is July (18.1 °C). The coldest month, with the lowest average minimum temperature, is February (1.9 °C). Overall, the average minimum temperature over the whole year is 9.8 °C.

Water temperature in Pula

The month with the highest average water temperature is August (25.2 °C). The month with the lowest average water temperature is February (10.3 °C). Overall, the average water temperature over the whole year is 17.7 °C.

Rainfall amount in Pula

The wettest month, with the highest amount of precipitation, is December (113 mm). The driest month, with the least amount of precipitation, is July (47.4 mm). Over the whole year there are 870.9 mm of rainfall on average.

Rainfall days in Pula

The month with the most days of rain is June (13.1 days). The month with the fewest days of rain is July (10 days). Over the whole year there are 145.2 days of rain on average.

Daylight hours and sunshine hours in Pula

The month with the longest days, so the most daylight, is June (Average daylight: 15 h). The month with the shortest days, so the least daylight, is December (Average daylight: 8.1 h). Over the whole year there are 11.8 h of daylight per day on average.

The month with the most sunshine per day is July (Average sunshine: 9.9 h). The month with the least sunshine per day is December (Average sunshine: 2.9 h). Over the whole year there are 6 h of sunlight per day on average.

UV index in Pula

The months with the highest average UV index are June and July (UV index: 8). The months with the lowest average UV index are January and December (UV index: 1). Over the whole year the average UV index is 4.3.

Was this page helpful?
Feedback