San Juan climate data

San Juan, Puerto Rico’s vibrant capital, enjoys a tropical climate with warm temperatures and high humidity year-round. The city features a distinct wet season from May to November and a dry season from December to April. With abundant sunshine, balmy trade winds, and consistently warm ocean waters, San Juan is a favourite for beachgoers and outdoor enthusiasts.

Best times to travel

The best times to travel section shows how the months compare for a visit, so you can find the time of year that fits what you want to do.

Background colours of the months:
The colour shows the typical temperature: yellow (hot), green (mild) and blue (cold). How strong the colour is shows the travel season: full colour means high season, soft colour means shoulder season and soft-striped means off season.

Weather symbols:
Each month has one symbol showing what the weather is typically like, such as hot and sunny, freezing or a rainy or snowy season. Use them to quickly spot months that match the weather you want, or to avoid the ones that don't.

Crowdedness:
The people icon shows how busy the place usually is. The more people, the more crowded it gets.

Additional notes:
The grey info boxes point out special things worth knowing, like recurring weather issues or seasonal events.

for San Juan, Puerto Rico
☀️
Jan
☀️
Feb
☀️
Mar
☀️
Apr
☀️
May
🔥
Jun
🔥
Jul
🔥
Aug
🔥
Sep
🔥
Oct
🔥
Nov
🌤️
Dec
High season: Jan. - April, Dec.
Shoulder season: May - July, Nov.
Crowdedness: 8 (Very crowded)
Tap on a month for more info Hover over a month for more info
Hurricane season June to November, highest risk August to October
San Sebastián Street Festival (Old San Juan) runs mid January, huge crowds, hotels book out
Cruise ships dock mostly November to April, Old San Juan gets very crowded on port days

The climate of San Juan

San Juan’s climate is classified as tropical rainforest, marked by little temperature variation and two main seasons. The wet season runs from May to November, bringing hot, humid conditions, frequent afternoon showers, and the occasional tropical storm or hurricane, especially from August to October. September is typically the wettest month, with rainfall often exceeding 150 mm and up to 18 rainy days. Despite the rain, showers are usually brief, and sunshine quickly returns. Average highs during the wet season are 30–32°C, with lows around 24–26°C. Humidity is high, peaking at 77–80% in late summer and autumn, but sea breezes provide some relief.

The dry season, from December to April, is the most pleasant period, with lower humidity, less rainfall, and abundant sunshine. Daytime highs average 28–30°C, and nights are comfortable at 21–23°C. February is the driest month, with only about 47 mm of rain. San Juan enjoys up to 9.5 hours of sunshine per day in spring, and even the cloudier months offer 6–7 hours daily. Winds are gentle to moderate, averaging 10–18 km/h, and the trade winds help keep conditions comfortable. Ocean temperatures remain warm year-round, ranging from 26°C in winter to 29°C in late summer. Snow and frost are unknown in San Juan, and temperature swings between seasons are minimal, making it a true year-round tropical destination.

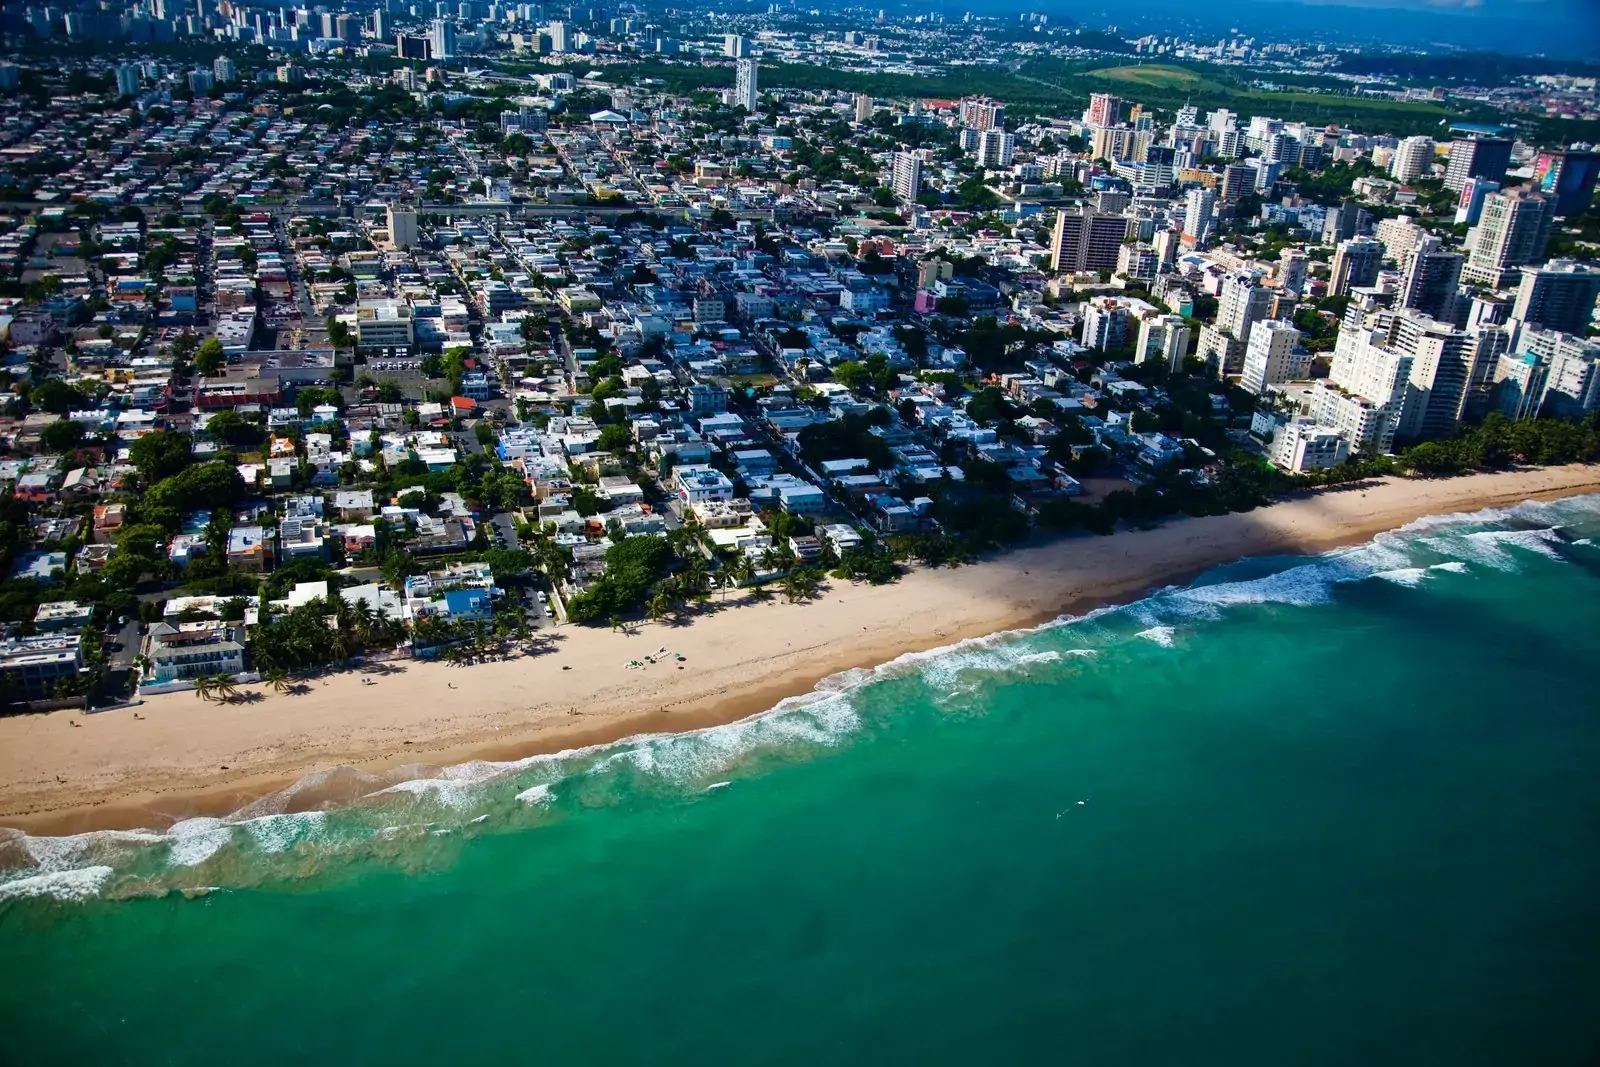
Average climate data for San Juan, United States
Month Jan Feb Mar Apr May Jun Jul Aug Sep Oct Nov Dec Year
Average maximum temperature (°C) 27 27 27 27 28 29 29 29 29 29 28 27 29
Average minimum temperature (°C) 24 23 23 24 25 26 26 26 26 26 25 24 23
Average precipitation (mm) 21 15 22 14 27 18 28 27 30 38 40 25 306
Average rainfall days (days) 11 12 13 12 15 10 13 15 12 16 16 15 160
Average relative humidity (%) 78 76 75 76 78 78 80 77 79 78 77 76 77
Average wind speed (km/h) 16 16 15 15 14 16 17 17 13 12 13 16 15
Average water temperature (°C) 26 26 26 27 28 28 29 29 29 29 29 28 28
Average daily daylight hours (h) 11 11 12 12 13 13 13 12 12 11 11 11 12
Average daily sunshine hours (h) 8 8 8 9 10 10 10 9 9 8 6 6 8
Average cloud coverage (%) 31 31 30 30 34 31 34 32 25 29 34 36 31
Average UV index 6 6 6 7 7 7 7 7 7 7 7 6 7

Travel info

  • Winter (December–February): Warm, dry, and sunny, with highs of 28–29°C and lows of 21–22°C. Ideal for beach activities, festivals, and sightseeing. Pack light clothing and sun protection.
  • Spring (March–May): Warm and gradually more humid, with highs of 29–31°C. Rainfall increases slightly by May. Fewer crowds and great weather for outdoor adventures.
  • Summer (June–August): Hot, humid, and rainy, with highs of 31–32°C. Afternoon showers are common, but mornings are usually sunny. Hurricane risk increases from August onward. Stay hydrated and seek shade during midday.
  • Autumn (September–November): Warm and very rainy, with highs of 30–31°C. September and October are the wettest and most hurricane-prone months. Rain often falls in heavy, short bursts. Monitor forecasts and bring waterproof gear.
  • Travel Tips: Always use sun protection and stay hydrated. Book early for winter and spring, the busiest seasons. Hurricane season runs June–November – consider travel insurance and check weather updates if visiting in late summer or autumn.

The best time to visit San Juan

The best time to visit San Juan is from December to April, when the weather is warm (28–30°C), dry, and sunny, with low humidity and little rain. These months offer the most comfortable conditions for beach activities, festivals, and exploring the city, making it the peak tourist season.

The worst time to visit San Juan

The least favourable time is from August to October, when San Juan is hottest, most humid, and wettest. Heavy rain, high humidity, and the risk of hurricanes or tropical storms can disrupt travel plans. Outdoor activities may be limited by frequent downpours, though sunshine usually returns quickly.

Frequently asked questions

What is the climate like in San Juan year-round?

San Juan has a tropical climate with warm temperatures (28–32°C) and high humidity all year. The wet season runs from May to November, while December to April is drier and sunnier.

When is the best time to visit San Juan?

The best time to visit is from December to April, when the weather is warm, dry, and sunny. These months are ideal for beach activities, festivals, and exploring the city.

Does San Juan experience hurricanes?

Yes, hurricane season runs from June to November, with the highest risk from August to October. Most storms pass without major impact, but travellers should monitor forecasts and consider travel insurance.

How warm is the ocean in San Juan?

Ocean temperatures in San Juan are warm year-round, ranging from 26°C in winter to 29°C in late summer. Swimming and water sports are possible in every season.

How much does it rain in San Juan?

San Juan receives about 1,200 mm of rain annually, with most rainfall from May to November. September is usually the wettest month, while February is the driest.

Is it sunny in San Juan?

Yes, San Juan enjoys abundant sunshine, with up to 9.5 hours per day in spring. Even during the wet season, showers are brief and the sun returns quickly.

Minimum and maximum temperatures in San Juan

The warmest month, with the highest average maximum temperature, is August (29.5 °C). The month with the lowest average maximum temperature is January (26.6 °C). Overall, the average maximum temperature over the whole year is 28 °C.

The month with the highest average minimum temperature is October (26.2 °C). The coldest month, with the lowest average minimum temperature, is March (23.4 °C). Overall, the average minimum temperature over the whole year is 25 °C.

Water temperature in San Juan

The month with the highest average water temperature is September (29.4 °C). The month with the lowest average water temperature is March (26.1 °C). Overall, the average water temperature over the whole year is 27.9 °C.

Rainfall amount in San Juan

The wettest month, with the highest amount of precipitation, is November (40.5 mm). The driest month, with the least amount of precipitation, is April (14 mm). Over the whole year there are 306.2 mm of rainfall on average.

Rainfall days in San Juan

The month with the most days of rain is November (16 days). The month with the fewest days of rain is June (10.2 days). Over the whole year there are 160 days of rain on average.

Relative humidity in San Juan

The month with the highest average relative humidity is July (79.8 %). The month with the lowest average relative humidity is March (75.4 %). The overall average relative humidity over the whole year is 77.3 %.

Wind speed in San Juan

The windiest month, with the highest average wind speed, is July (17 km/h). The calmest month, with the lowest average wind speed, is October (12.1 km/h). The overall average wind speed over the whole year is 15 km/h.

Cloud coverage in San Juan

The month with the cloudiest skies, so the highest cloud coverage, is December (35.9 %). The month with the clearest skies, so the lowest cloud coverage, is September (25.1 %). Over the whole year there is an average cloud coverage of 31.4 %.

Daylight hours and sunshine hours in San Juan

The months with the longest days, so the most daylight, are June and July (Average daylight: 13 h). The month with the shortest days, so the least daylight, is December (Average daylight: 11 h). Over the whole year there are 11.9 h of daylight per day on average.

The month with the most sunshine per day is July (Average sunshine: 10.1 h). The month with the least sunshine per day is November (Average sunshine: 6.1 h). Over the whole year there are 8.5 h of sunlight per day on average.

UV index in San Juan

The months with the highest average UV index are April, May, June, July, August, September, October and November (UV index: 7). The months with the lowest average UV index are January, February, March and December (UV index: 6). Over the whole year the average UV index is 6.7.

Was this page helpful?
Feedback