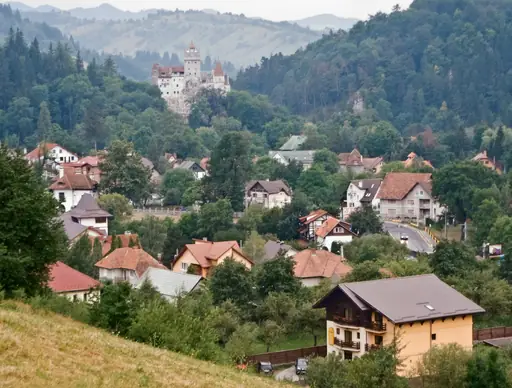
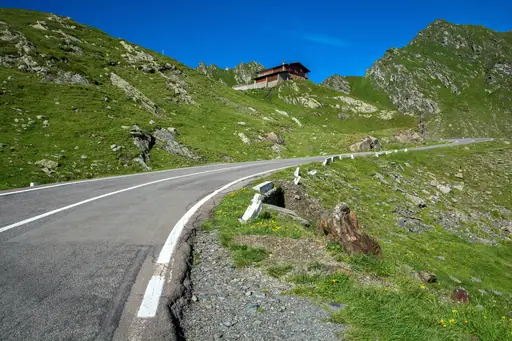
TiberiuSahlean, CC BY-SA 3.0 RO, via Wikimedia Commons
Europe › Romania › Sinaia › Climate

Sinaia climate data

Sinaia features a temperate continental climate with warm, rainy summers and cold, snowy winters. Summer highs reach 19–24°C, while winter lows can drop to -8°C. Precipitation is high year-round, peaking in June, and snow is common in winter. Sunshine is most abundant from May to August, making Sinaia a year-round destination for mountain activities.

Best times to travel

The best times to travel section shows how the months compare for a visit, so you can find the time of year that fits what you want to do.

Background colours of the months:
The colour shows the typical temperature: yellow (hot), green (mild) and blue (cold). How strong the colour is shows the travel season: full colour means high season, soft colour means shoulder season and soft-striped means off season.

Weather symbols:
Each month has one symbol showing what the weather is typically like, such as hot and sunny, freezing or a rainy or snowy season. Use them to quickly spot months that match the weather you want, or to avoid the ones that don't.

Crowdedness:
The people icon shows how busy the place usually is. The more people, the more crowded it gets.

Additional notes:
The grey info boxes point out special things worth knowing, like recurring weather issues or seasonal events.

for Sinaia, Romania
🌨️
Jan
🌨️
Feb
🌨️
Mar
🌨️
Apr
🌨️
May
🌥️
Jun
🌥️
Jul
🌥️
Aug
🌤️
Sep
🌨️
Oct
🌨️
Nov
🌨️
Dec
High season: Jan. - Feb., June - Sep., Dec.
Shoulder season: March, May, Oct.
Crowdedness: 7 (Many tourists)
Tap on a month for more info Hover over a month for more info
Ski season usually December to March, the Bucegi slopes can hold snow into April at higher altitudes
Weekends and Romanian holidays (Christmas, New Year, Easter, 15 August) are very crowded, with traffic jams on the Prahova Valley road and trains from Bucharest
Peleș Castle is closed on Mondays, and Tuesday to Sunday opening hours are shorter from mid-autumn to spring

The climate of Sinaia

Sinaia, nestled in the Carpathian Mountains, experiences pronounced seasonal contrasts due to its elevation and continental influences. Summers (June–August) are mild to warm, with average highs of 19–24°C and lows around 8°C. July and August are the sunniest months, offering up to 6 hours of sunshine daily and long daylight hours. Rainfall is frequent and heavy in summer, peaking in June with up to 138–155 mm over 17–18 days. Thunderstorms are common, keeping the landscape lush and green – ideal for hiking and exploring the region’s natural beauty.

Winters (December–February) are cold and snowy, with average highs of -1–1°C and lows dipping to -8°C. Snow is frequent, especially in January and February, making Sinaia a hub for winter sports. December and January are the cloudiest months, with only 2–3 hours of sunshine daily. Spring (March–May) and autumn (September–November) are transitional, featuring mild to cool temperatures (5–16°C), frequent rain, and colourful scenery. October is the driest month, but precipitation remains significant year-round. Winds are generally gentle, though brisk gusts can occur during storms, especially in winter and spring. Sinaia receives about 1,020–1,051 mm of precipitation annually, with rain or snow possible in any month.

Average climate data for Sinaia, Romania
Month Jan Feb Mar Apr May Jun Jul Aug Sep Oct Nov Dec Year
Average maximum temperature (°C) 1 2 3 5 9 14 21 21 17 11 3 1 21
Average minimum temperature (°C) -8 -8 -7 -5 -2 1 5 5 2 -1 -6 -8 -8
Average precipitation (mm) 236 197 190 137 90 58 27 26 50 111 264 292 1,677
Average rainfall days (days) 18 16 18 16 11 8 4 4 6 10 17 18 145
Average snowfall (mm) 2,222 1,804 1,845 1,172 408 105 2 0 85 461 1,811 2,309 12,224
Average snowfall days (days) 16 14 16 12 6 2 0 0 1 5 13 16 101
Average relative humidity (%) 67 69 72 75 80 81 84 84 84 82 78 73 77
Average wind speed (km/h) 8 9 9 9 10 9 10 10 9 7 7 8 9
Average daily daylight hours (h) 9 10 12 13 14 15 15 13 12 11 9 9 12
Average daily sunshine hours (h) 4 5 7 8 10 11 12 11 9 7 3 3 8
Average cloud coverage (%) 12 10 18 30 41 54 55 55 44 41 31 23 34
Average UV index 2 2 4 6 8 9 9 8 6 4 2 1 5

Travel info

  • Spring (March–May): Cool to mild, highs of 5–16°C. Frequent rain and blooming landscapes – bring layers and a rain jacket. Trails may be muddy or snow-covered at higher elevations.
  • Summer (June–August): Mild to warm, highs of 19–24°C. Frequent rain and thunderstorms, long daylight, and lush scenery – pack light clothes, sun protection, and waterproof gear. Ideal for hiking and outdoor activities.
  • Autumn (September–November): Cooling rapidly, highs of 5–16°C. Rain increases in November, and autumn colours appear – dress in layers and bring waterproof shoes.
  • Winter (December–February): Cold and snowy, highs of -1–1°C, lows to -8°C. Short days, frequent snow, and limited sunshine – pack thermal layers, a warm coat, gloves, and waterproof boots. Great for skiing and snow sports.
  • General Tips: Sinaia weather is unpredictable – always check the forecast and pack for rain, sun, and cold. Summer is best for hiking and sightseeing; winter is for snow sports. Good walking shoes and rain gear are essential year-round.

The best time to visit Sinaia

The best time to visit Sinaia is from June to September, when temperatures are mild (16–24°C), trails are mostly snow-free, and the region is vibrant with greenery and festivals. These months offer long daylight, abundant sunshine, and the best conditions for hiking, sightseeing, and outdoor adventures, though afternoon rain showers are common.

The worst time to visit Sinaia

The least favourable time to visit is from November to March, when days are shortest, temperatures are coldest (highs of -1–5°C, lows to -8°C), and rain or snow is frequent. Many hiking trails are closed or snow-covered, and outdoor activities are limited to winter sports, though the scenery is magical for those seeking a snowy mountain experience.

Frequently asked questions

What is the weather like in Sinaia year-round?

Sinaia has mild, rainy summers (highs 19–24°C) and cold, snowy winters (highs -1–1°C, lows to -8°C). Rain and snow fall year-round, with the wettest months in summer and the snowiest in winter.

Does it snow in Sinaia?

Yes, snow is common from December to March, especially in January and February. The town and surrounding mountains are ideal for winter sports, though heavy snow can sometimes close trails or roads.

When is Sinaia sunniest?

May to August are the sunniest months, with up to 6 hours of sunshine daily in July and August. Winter months are much gloomier, with only 2–3 hours of sun per day.

How much rain does Sinaia get?

Sinaia receives about 1,020–1,051 mm of precipitation annually. June is the wettest month (138–155 mm), while October is the driest (46–62 mm). Rain and snow are possible in any month.

What should I pack for Sinaia’s weather?

Pack layers, waterproof clothing, and sturdy shoes. Even in summer, rain gear is essential. In winter, bring thermal layers, a warm coat, gloves, and boots. Sun protection is useful year-round due to elevation.

Is Sinaia good for outdoor activities?

Yes, summer is ideal for hiking, sightseeing, and festivals, while winter is best for skiing and snowboarding. Spring and autumn offer beautiful scenery, but weather can be wet and some trails may be closed.

When are Sinaia’s crowds the smallest?

Crowds are smallest in late autumn (October–November) and early spring (March–April). Winter is quieter except for ski holidays. Summer is busiest, especially July and August.


Minimum and maximum temperatures in Sinaia

The warmest month, with the highest average maximum temperature, is August (20.9 °C). The month with the lowest average maximum temperature is December (1 °C). Overall, the average maximum temperature over the whole year is 9 °C.

The month with the highest average minimum temperature is July (4.8 °C). The coldest month, with the lowest average minimum temperature, is February (-7.8 °C). Overall, the average minimum temperature over the whole year is -2.6 °C.

Rainfall amount in Sinaia

The wettest month, with the highest amount of precipitation, is December (291.6 mm). The driest month, with the least amount of precipitation, is August (25.7 mm). Over the whole year there are 1,677 mm of rainfall on average.

Rainfall days in Sinaia

The month with the most days of rain is March (18.1 days). The month with the fewest days of rain is July (3.9 days). Over the whole year there are 145.5 days of rain on average.

Snowfall amount in Sinaia

The month with the most snowfall is December (2,309.1 mm). The month with the least snowfall is August (0 mm). Over the whole year there are 12,223.7 mm of snowfall on average.

Snowfall days in Sinaia

The month with the most days of snowfall is December (16.3 days). The month with the fewest days of snowfall is July (0 days). Over the whole year there are 101.1 days of snowfall on average.

Relative humidity in Sinaia

The month with the highest average relative humidity is September (84.1 %). The month with the lowest average relative humidity is January (67.2 %). The overall average relative humidity over the whole year is 77.3 %.

Wind speed in Sinaia

The windiest month, with the highest average wind speed, is July (10.2 km/h). The calmest month, with the lowest average wind speed, is November (7.3 km/h). The overall average wind speed over the whole year is 8.8 km/h.

Cloud coverage in Sinaia

The month with the cloudiest skies, so the highest cloud coverage, is July (54.7 %). The month with the clearest skies, so the lowest cloud coverage, is February (10 %). Over the whole year there is an average cloud coverage of 34.4 %.

Daylight hours and sunshine hours in Sinaia

The month with the longest days, so the most daylight, is June (Average daylight: 15 h). The month with the shortest days, so the least daylight, is December (Average daylight: 9 h). Over the whole year there are 11.9 h of daylight per day on average.

The month with the most sunshine per day is July (Average sunshine: 12.1 h). The month with the least sunshine per day is November (Average sunshine: 3 h). Over the whole year there are 7.5 h of sunlight per day on average.

UV index in Sinaia

The months with the highest average UV index are June and July (UV index: 9). The month with the lowest average UV index is December (UV index: 1). Over the whole year the average UV index is 5.1.

Was this page helpful?
Feedback