We use cookies and external services: MapTiler for interactive maps and Google Maps to show route duration/distance. Both may process personal data such as your IP address, including transfers outside the EU/EEA. See our privacy policy for details. By clicking ‘Accept all’, you consent to this.
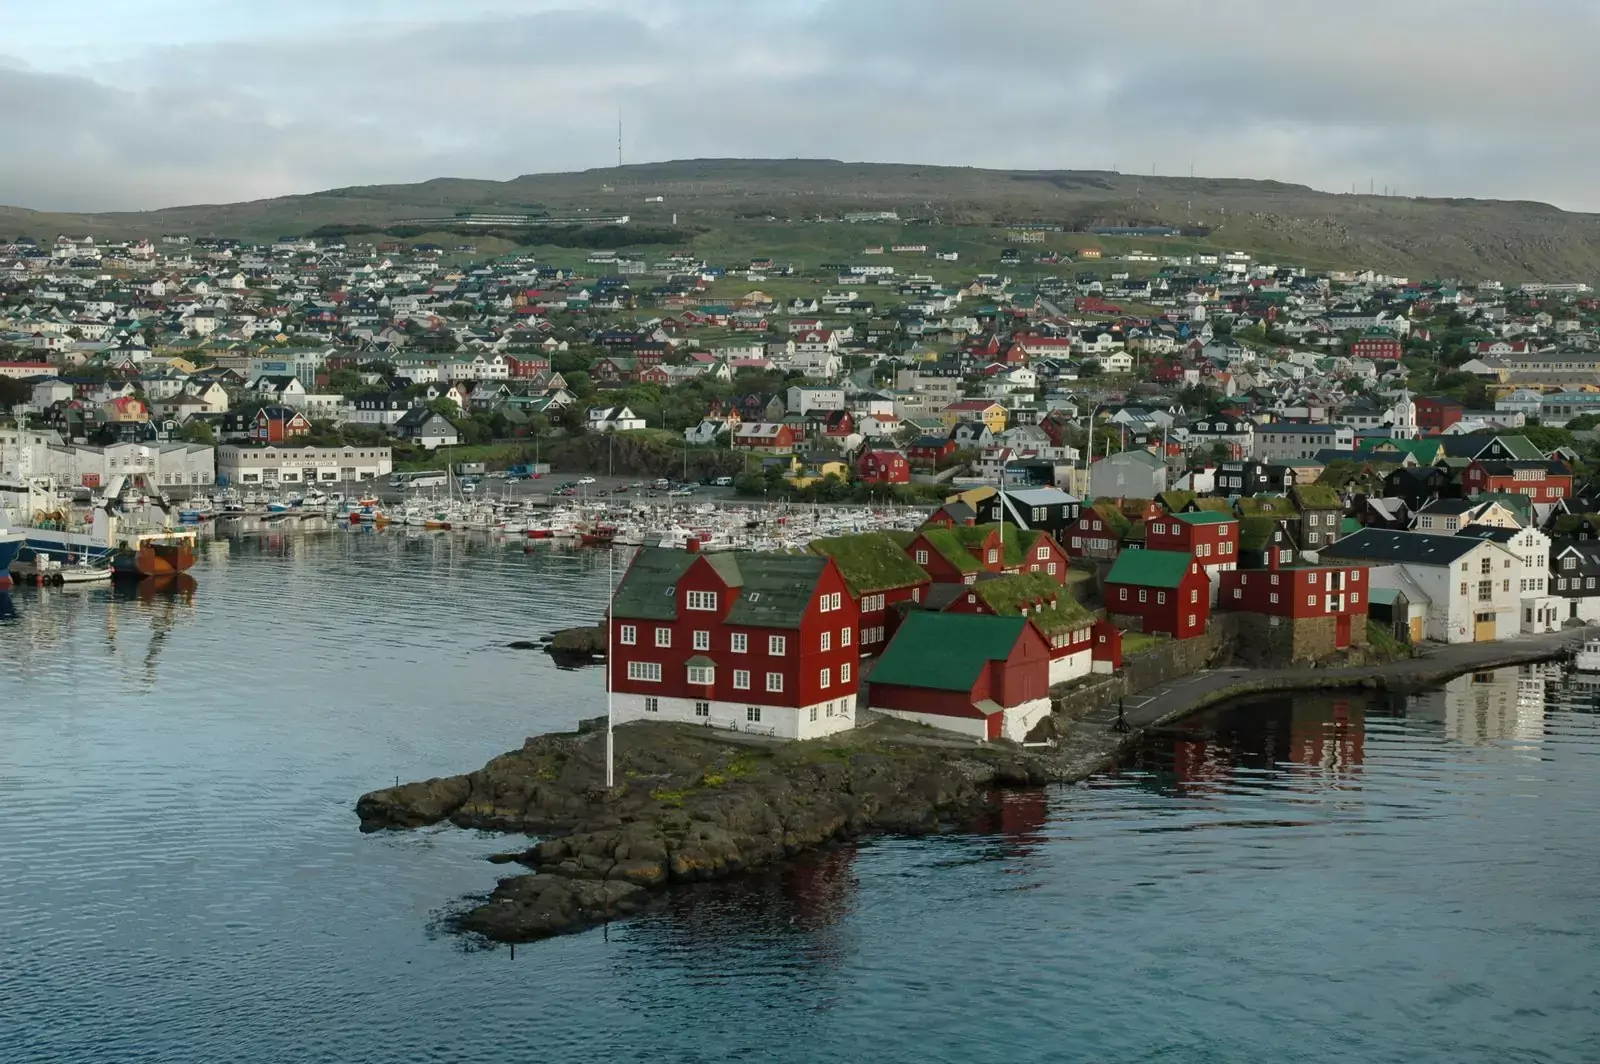
Tórshavn, the capital of the Faroe Islands, features a cool, maritime subpolar climate with mild winters, cool summers, and frequent rain and wind year-round. The weather is highly variable, with cloudy skies and sudden changes being the norm. Visitors should be prepared for rapidly shifting conditions, making layered and waterproof clothing essential for any trip.
The best times to travel section shows how the months compare for a visit, so you can find the time of year that fits what you want to do.
Background colours of the months:
The colour shows the typical temperature: yellow (hot), green (mild) and blue (cold). How strong the colour is shows the travel season: full colour means high season, soft colour means shoulder season and soft-striped means off season.
Weather symbols:
Each month has one symbol showing what the weather is typically like, such as hot and sunny, freezing or a rainy or snowy season. Use them to quickly spot months that match the weather you want, or to avoid the ones that don't.
Crowdedness:
The people icon shows how busy the place usually is. The more people, the more crowded it gets.
Additional notes:
The grey info boxes point out special things worth knowing, like recurring weather issues or seasonal events.
The climate of Tórshavn
Tórshavn experiences a subpolar oceanic climate (Köppen Cfc), shaped by its North Atlantic location. The city is characterised by cool summers, with average highs of 11–13°C from June to August, and mild winters, where temperatures typically range from 2–6°C. Extreme temperatures are rare: summer rarely exceeds 15°C, and winter temperatures seldom fall below freezing. The weather is famously unpredictable, with rapid shifts between sunshine, rain, mist, and wind often occurring within a single day.
Rainfall is abundant and well-distributed throughout the year, averaging around 1,300–1,400 mm annually. Autumn and winter (September to March) are the wettest periods, while late spring and early summer (May to July) are relatively drier. Snowfall occurs mainly from November to April but is generally light and short-lived at sea level, though higher elevations can see more persistent snow. Tórshavn is also among the cloudiest capitals in the world, with as little as 840–1,000 hours of sunshine annually, and fog is common.
Wind is a defining feature of Tórshavn’s climate. Average wind speeds range from 5 km/h in summer to nearly 8 km/h in winter, with powerful gusts and frequent storms, especially in autumn and winter. Daylight varies dramatically: in midsummer, the city enjoys up to 19 hours of light, while in midwinter, daylight can dwindle to just 5 hours. These unique conditions create a rugged, atmospheric environment that is both challenging and captivating for visitors.
| Average climate data for Tórshavn, Faroe Islands | |||||||||||||
|---|---|---|---|---|---|---|---|---|---|---|---|---|---|
| Month | Jan | Feb | Mar | Apr | May | Jun | Jul | Aug | Sep | Oct | Nov | Dec | Year |
| Average maximum temperature (°C) | 20 | 20 | 18 | 15 | 13 | 11 | 11 | 12 | 13 | 15 | 17 | 18 | 20 |
| Average minimum temperature (°C) | 11 | 11 | 10 | 9 | 7 | 6 | 5 | 5 | 6 | 7 | 8 | 9 | 5 |
| Average precipitation (mm) | 23 | 25 | 31 | 28 | 30 | 34 | 26 | 38 | 25 | 23 | 38 | 35 | 356 |
| Average rainfall days (days) | 13 | 12 | 14 | 14 | 14 | 11 | 13 | 14 | 15 | 14 | 16 | 14 | 164 |
| Average snowfall days (days) | 0 | 0 | 0 | 0 | 0 | 0 | 0 | 0 | 0 | 0 | 0 | 0 | 0 |
| Average relative humidity (%) | 73 | 76 | 77 | 78 | 80 | 82 | 81 | 79 | 77 | 75 | 76 | 73 | 77 |
| Average wind speed (km/h) | 13 | 12 | 11 | 12 | 13 | 12 | 13 | 14 | 15 | 13 | 13 | 13 | 13 |
| Average water temperature (°C) | 8 | 7 | 7 | 8 | 8 | 9 | 11 | 11 | 11 | 10 | 9 | 8 | 9 |
| Average daily daylight hours (h) | 14 | 13 | 12 | 10 | 9 | 9 | 9 | 10 | 11 | 13 | 14 | 15 | 12 |
| Average daily sunshine hours (h) | 9 | 7 | 7 | 7 | 6 | 5 | 6 | 6 | 7 | 7 | 8 | 9 | 7 |
| Average cloud coverage (%) | 40 | 43 | 43 | 44 | 43 | 44 | 43 | 43 | 43 | 41 | 47 | 42 | 43 |
| Average UV index | 4 | 4 | 4 | 4 | 3 | 3 | 3 | 3 | 3 | 4 | 4 | 5 | 4 |
Travel info
- Spring (March–May): Chilly and wet, with temperatures rising from 4°C to 9°C. Snow is possible in March and April. Days lengthen, and wildflowers begin to bloom. Layered clothing and waterproof gear are recommended.
- Summer (June–August): Cool and relatively dry, with highs of 11–13°C. Long daylight hours (up to 19 hours) make this the best time for outdoor activities like hiking and sightseeing. Sudden weather changes and persistent wind are common – always carry rain gear.
- Autumn (September–November): Mild but increasingly wet and windy. Temperatures drop from 11°C to 6°C. Storms and heavy rain become more frequent. Days shorten rapidly; pack sturdy, waterproof clothing.
- Winter (December–February): Mild by northern standards (2–6°C), but very wet, windy, and dark. Snow is possible but rarely heavy at sea level. Daylight is limited to 5–6 hours. Expect frequent storms and gales – prepare for tough weather conditions.
- Travel tip: Tórshavn’s weather is extremely changeable; always check the forecast before heading out, and pack layers, waterproofs, and windproof jackets regardless of season.
The best time to visit Tórshavn
The best time to visit Tórshavn is from late May to early August, when the weather is at its mildest, rainfall is relatively low, and daylight hours are long – ideal for hiking, sightseeing, and wildlife watching. Summer offers the most stable conditions for outdoor activities, and visitors can enjoy nearly continuous daylight during midsummer.
The worst time to visit Tórshavn
The least favourable time to visit Tórshavn is from November to February. During these months, the city experiences the highest rainfall, frequent storms, strong winds, and very limited daylight – sometimes as little as 5 hours per day. Outdoor activities are often disrupted, and the weather can feel harsh and unwelcoming.
Frequently asked questions
Tórshavn has a cool, maritime subpolar climate with mild winters, cool summers, and frequent rain and wind year-round. Weather conditions change rapidly, so visitors should always be prepared for sudden shifts.
Late May to early August is ideal for outdoor activities in Tórshavn. During this period, temperatures are mild, rainfall is lower, and daylight hours are longest, providing excellent conditions for hiking, sightseeing, and exploring nature.
Snow can occur in Tórshavn from November to April, but it is usually light and melts quickly at sea level. In higher elevations, snow may persist longer, but heavy snowfalls are rare in the city itself.
Tórshavn receives abundant rainfall, averaging 1,300–1,400 mm annually. Rain can occur at any time of year, but autumn and winter are the wettest periods. Waterproof clothing is essential for visitors.
Yes, Tórshavn is known for its strong and persistent winds, especially in autumn and winter. Average wind speeds are highest during these seasons, and storms with powerful gusts are common. Windproof gear is highly recommended.
Daylight in Tórshavn varies greatly with the seasons. In midsummer, the city enjoys up to 19 hours of daylight, while in midwinter, daylight can be as short as 5 hours. Cloudy skies are common year-round.
Pack layered clothing, waterproof and windproof jackets, and sturdy shoes. Weather can change quickly, so it’s best to be prepared for rain, wind, and cool temperatures regardless of the season.
Minimum and maximum temperatures in Tórshavn
The warmest month, with the highest average maximum temperature, is January (20 °C). The month with the lowest average maximum temperature is July (10.8 °C). Overall, the average maximum temperature over the whole year is 15.3 °C.
The month with the highest average minimum temperature is January (11.1 °C). The coldest month, with the lowest average minimum temperature, is August (4.9 °C). Overall, the average minimum temperature over the whole year is 7.8 °C.
Water temperature in Tórshavn
The month with the highest average water temperature is August (11.2 °C). The month with the lowest average water temperature is March (7.1 °C). Overall, the average water temperature over the whole year is 8.9 °C.
Rainfall amount in Tórshavn
The wettest month, with the highest amount of precipitation, is November (38.3 mm). The driest month, with the least amount of precipitation, is October (23.1 mm). Over the whole year there are 356 mm of rainfall on average.
Rainfall days in Tórshavn
The month with the most days of rain is November (15.9 days). The month with the fewest days of rain is June (11.3 days). Over the whole year there are 163.8 days of rain on average.
Snowfall days in Tórshavn
The month with the most days of snowfall is March (0.1 days). The months with the fewest days of snowfall are April, May, June, August, September and October (0 days). Over the whole year there are 0.3 days of snowfall on average.
Relative humidity in Tórshavn
The month with the highest average relative humidity is June (82.1 %). The month with the lowest average relative humidity is December (72.7 %). The overall average relative humidity over the whole year is 77.1 %.
Wind speed in Tórshavn
The windiest month, with the highest average wind speed, is September (14.5 km/h). The calmest month, with the lowest average wind speed, is March (11.5 km/h). The overall average wind speed over the whole year is 12.8 km/h.
Cloud coverage in Tórshavn
The month with the cloudiest skies, so the highest cloud coverage, is November (46.7 %). The month with the clearest skies, so the lowest cloud coverage, is January (39.6 %). Over the whole year there is an average cloud coverage of 42.8 %.
Daylight hours and sunshine hours in Tórshavn
The month with the longest days, so the most daylight, is December (Average daylight: 15 h). The month with the shortest days, so the least daylight, is June (Average daylight: 9 h). Over the whole year there are 11.6 h of daylight per day on average.
The month with the most sunshine per day is December (Average sunshine: 9 h). The month with the least sunshine per day is June (Average sunshine: 5.1 h). Over the whole year there are 7.1 h of sunlight per day on average.
UV index in Tórshavn
The month with the highest average UV index is December (UV index: 5). The months with the lowest average UV index are May, June, July, August and September (UV index: 3). Over the whole year the average UV index is 3.7.
- Tórshavn climate overview
- Climate table
- Related travel information for Tórshavn
- The best time to visit Tórshavn
- The worst time to visit Tórshavn
- Frequently asked questions
- Temperature summary
- Water temperature summary
- Rainfall amount summary
- Rainfall days summary
- Snowfall days summary
- Relative humidity summary
- Wind speed summary
- Cloud coverage summary
- Daylight hours and sunshine hours summary
- UV index summary
- Other recommended travel destinations