Asia › Turkey › Muğla › Climate

Mugla climate data

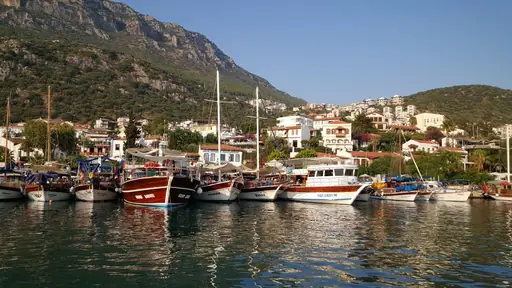
Mugla, in southwestern Turkey, enjoys a Mediterranean climate with hot, dry summers and mild, wetter winters. The region is known for its abundant sunshine, dramatic seasonal temperature swings, and long beach season. Mugla’s climate supports vibrant natural scenery and makes it a popular destination for sunseekers, outdoor adventurers, and those looking to explore the famed Turkish Riviera.

Best times to travel

The best times to travel section shows how the months compare for a visit, so you can find the time of year that fits what you want to do.

Background colours of the months:
The colour shows the typical temperature: yellow (hot), green (mild) and blue (cold). How strong the colour is shows the travel season: full colour means high season, soft colour means shoulder season and soft-striped means off season.

Weather symbols:
Each month has one symbol showing what the weather is typically like, such as hot and sunny, freezing or a rainy or snowy season. Use them to quickly spot months that match the weather you want, or to avoid the ones that don't.

Crowdedness:
The people icon shows how busy the place usually is. The more people, the more crowded it gets.

Additional notes:
The grey info boxes point out special things worth knowing, like recurring weather issues or seasonal events.

for Muğla, Turkey
⛈️
Jan
🌦️
Feb
🌤️
Mar
🌤️
Apr
☀️
May
🔥
Jun
🔥
Jul
🔥
Aug
🔥
Sep
☀️
Oct
🌤️
Nov
⛈️
Dec
High season: June - Sep.
Shoulder season: April - May, Oct.
Crowdedness: 7 (Many tourists)
Tap on a month for more info Hover over a month for more info
Most hotels, restaurants and beach clubs close November to March, main season May to October
Wildfire risk July to September can disrupt travel and stays, especially in forested areas
Resorts differ: Bodrum and Marmaris are lively and busy, Datça and Göcek quieter; gulet sailing season runs May to October

The climate of Mugla

Mugla’s Mediterranean climate (Köppen Csa) features distinct seasonal contrasts. Summers (June to September) are hot, arid, and clear, with average daytime highs reaching 32–34°C in July and August. Nights remain comfortably warm, and rainfall is rare – July is the driest month, often with just 11 mm of precipitation. Sunshine is abundant, with up to 14 hours of daylight and 311 hours of sun in July. Sea temperatures peak at 25–26°C, ideal for swimming and water sports.

Winters (December to February) are mild but can be wet and cloudy, with average highs of 11–16°C and lows around 3–7°C. January is the wettest month, averaging 158–236 mm of rain over 12–15 days. Snow is rare at sea level but possible in higher inland elevations. Spring (March to May) and autumn (late September to November) offer pleasant, moderate weather – highs range from 16–26°C, and rainfall is moderate, supporting lush landscapes and wildflowers. Winds are generally light to moderate, but coastal breezes provide relief during summer heatwaves. Daylight varies from about 9.6 hours in December to nearly 15 hours in June.

Mugla’s climate supports a long tourism season, with the turquoise coast’s beaches, hiking trails, and ancient ruins drawing visitors from spring through late autumn. The region’s reliable sunshine and warm sea make it a top choice for beach holidays, while the mild shoulder seasons are perfect for sightseeing and outdoor activities.

Average climate data for Mugla, Turkey
Month Jan Feb Mar Apr May Jun Jul Aug Sep Oct Nov Dec Year
Average maximum temperature (°C) 10 11 14 19 24 30 34 34 29 23 17 11 34
Average minimum temperature (°C) 1 2 4 7 11 16 20 20 15 10 5 3 1
Average precipitation (mm) 223 180 118 72 46 23 10 10 23 70 137 273 1,185
Average rainfall days (days) 14 13 11 10 8 3 2 1 3 6 10 15 96
Average relative humidity (%) 76 76 73 67 60 52 46 46 49 62 72 80 63
Average water temperature (°C) 16 16 16 17 19 22 23 24 23 21 19 17 19
Average daily daylight hours (h) 9 10 12 13 14 14 14 13 12 11 10 9 12
Average daily sunshine hours (h) 4 5 6 7 8 10 11 10 9 7 5 3 7
Average UV index 2 3 5 7 8 10 10 9 7 5 3 2 6

Travel info

  • Spring (March–May): Mild and increasingly sunny, with highs from 16–26°C. Occasional rain showers and blooming landscapes. Ideal for sightseeing, hiking, and exploring ancient sites. Bring layers and a light rain jacket.
  • Summer (June–September): Hot, dry, and sunny, with highs of 32–34°C and warm nights. Perfect for beach holidays, water sports, and boat trips. Pack light clothing, sun protection, and stay hydrated. Beaches and resorts are busiest in July and August.
  • Autumn (October–November): Warm and pleasant in early autumn (24–29°C), cooling to 16–19°C by November. Rain increases gradually, especially in November. Great for outdoor activities with fewer crowds – bring a jacket for cooler evenings.
  • Winter (December–February): Mild but wetter, with highs of 11–16°C and lows near 3–7°C. Rain is more frequent, especially in January. Pack a waterproof jacket and layers for variable weather. Some attractions may have reduced hours.
  • Travel tip: For beach holidays, visit from June to September. For sightseeing and hiking, spring and autumn offer comfortable weather and fewer crowds. Always check the forecast in winter for rainy spells.

The best time to visit Mugla

The best time to visit Mugla is from late April to June and September to early October. During these months, temperatures are warm but not extreme, rainfall is low, and the region’s beaches, forests, and ancient sites are at their most pleasant. These periods offer ideal conditions for outdoor activities and sightseeing with fewer crowds.

The worst time to visit Mugla

The least favourable time to visit Mugla is from December to February, when rain is most frequent, days are shorter, and some attractions may operate reduced hours. While temperatures remain mild, the wetter and cloudier conditions can limit beach activities and outdoor excursions.

Frequently asked questions

What is the climate like in Mugla throughout the year?

Mugla has a Mediterranean climate with hot, dry summers and mild, wetter winters. Summer highs reach 32–34°C, while winter highs are 11–16°C. Most rain falls from December to February, and sunshine is abundant in summer.

When is the best time to visit Mugla for the beach?

The best beach weather is from June to September, when days are hot, dry, and sunny, and the sea is warm. Early summer and September offer slightly cooler, less crowded conditions.

Does it rain a lot in Mugla?

Rain is concentrated in winter, especially in January, which averages 158–236 mm over 12–15 days. Summers are extremely dry, with July and August often seeing little to no rainfall.

Are winters cold in Mugla?

Winters in Mugla are mild, with daytime highs of 11–16°C and lows around 3–7°C. While rain is more frequent, snow is rare at sea level but possible in higher inland areas.

How many hours of sunshine does Mugla get?

Mugla enjoys up to 14 hours of daylight in summer and about 9.6 hours in winter. July is the sunniest month, with an average of 311 hours of sunshine, while December is the darkest.

What should I pack for a trip to Mugla?

For summer, bring light, breathable clothing, swimwear, sun protection, and a hat. In spring and autumn, pack layers and a light rain jacket. For winter, a waterproof jacket and warm layers are recommended due to frequent rain.

Is Mugla suitable for travel in winter?

Mugla is suitable for winter travel thanks to its mild temperatures, but rain is more frequent and some days can be damp. The region’s historic and cultural attractions remain open, and there are fewer tourists.

Minimum and maximum temperatures in Mugla

The warmest month, with the highest average maximum temperature, is July (33.6 °C). The month with the lowest average maximum temperature is January (10.1 °C). Overall, the average maximum temperature over the whole year is 21.3 °C.

The month with the highest average minimum temperature is July (19.8 °C). The coldest month, with the lowest average minimum temperature, is January (1.4 °C). Overall, the average minimum temperature over the whole year is 9.5 °C.

Water temperature in Mugla

The month with the highest average water temperature is August (24.1 °C). The month with the lowest average water temperature is January (15.9 °C). Overall, the average water temperature over the whole year is 19.4 °C.

Rainfall amount in Mugla

The wettest month, with the highest amount of precipitation, is December (272.8 mm). The driest month, with the least amount of precipitation, is July (9.9 mm). Over the whole year there are 1,185.3 mm of rainfall on average.

Rainfall days in Mugla

The month with the most days of rain is December (14.9 days). The month with the fewest days of rain is August (1.3 days). Over the whole year there are 96.2 days of rain on average.

Relative humidity in Mugla

The month with the highest average relative humidity is December (79.6 %). The month with the lowest average relative humidity is July (45.7 %). The overall average relative humidity over the whole year is 63.2 %.

Daylight hours and sunshine hours in Mugla

The month with the longest days, so the most daylight, is June (Average daylight: 14.1 h). The month with the shortest days, so the least daylight, is December (Average daylight: 9.1 h). Over the whole year there are 11.8 h of daylight per day on average.

The month with the most sunshine per day is July (Average sunshine: 11 h). The month with the least sunshine per day is December (Average sunshine: 3.1 h). Over the whole year there are 7.1 h of sunlight per day on average.

UV index in Mugla

The months with the highest average UV index are June and July (UV index: 10). The months with the lowest average UV index are January and December (UV index: 2). Over the whole year the average UV index is 5.9.

Was this page helpful?
Feedback