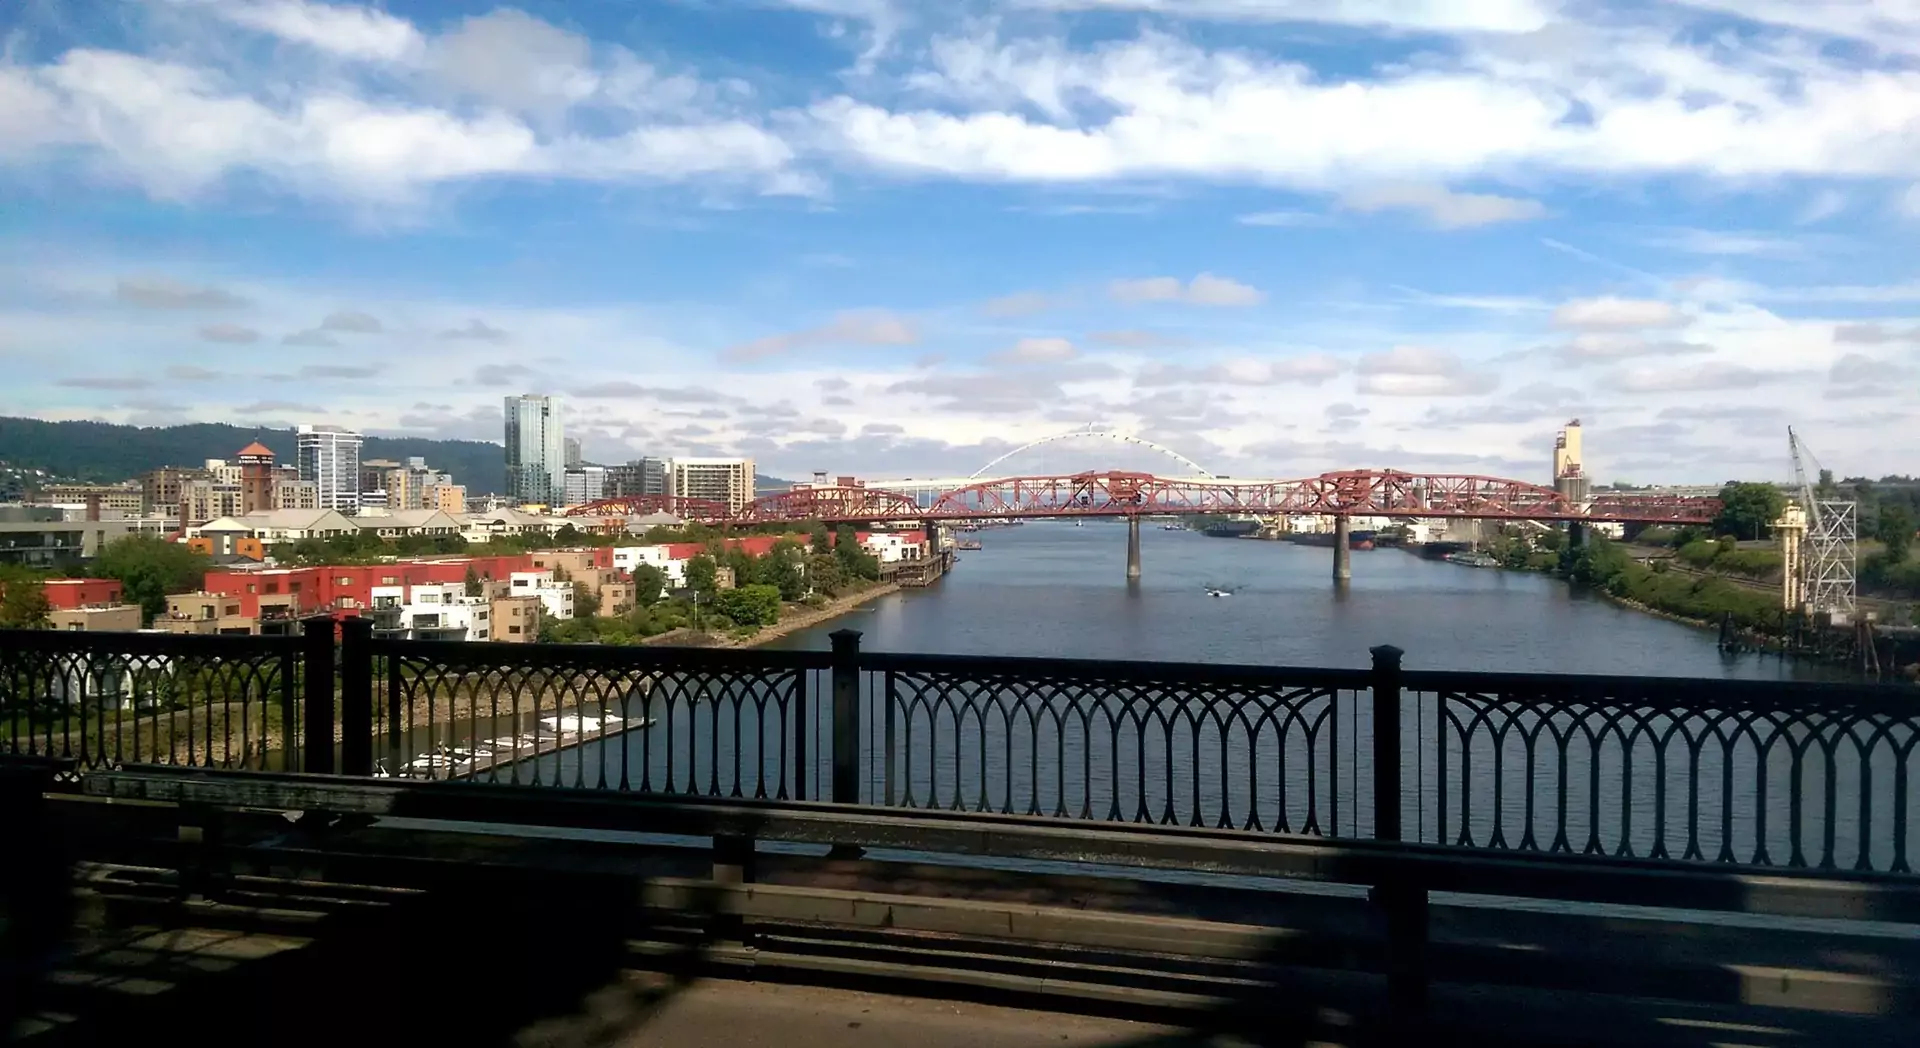






Alfred Twu, CC0, via Wikimedia Commons

Portland climate data

Best times to travel

The best times to travel section shows how the months compare for a visit, so you can find the time of year that fits what you want to do.

Background colours of the months:
The colour shows the typical temperature: yellow (hot), green (mild) and blue (cold). How strong the colour is shows the travel season: full colour means high season, soft colour means shoulder season and soft-striped means off season.

Weather symbols:
Each month has one symbol showing what the weather is typically like, such as hot and sunny, freezing or a rainy or snowy season. Use them to quickly spot months that match the weather you want, or to avoid the ones that don't.

Crowdedness:
The people icon shows how busy the place usually is. The more people, the more crowded it gets.

Additional notes:
The grey info boxes point out special things worth knowing, like recurring weather issues or seasonal events.

for Portland (Oregon), United States
🌧️
Jan
🌥️
Feb
🌧️
Mar
🌥️
Apr
🌤️
May
🌤️
Jun
☀️
Jul
☀️
Aug
☀️
Sep
🌤️
Oct
🌥️
Nov
🌧️
Dec
High season: June - Sep.
Shoulder season: April - May, Oct.
Crowdedness: 7 (Many tourists)
Tap on a month for more info Hover over a month for more info
Dry season July to September is clearly best for outdoor activities; rain is frequent November to March
Wildfire smoke can affect air quality from late July to September
Rose Festival late May to mid June, with the Grand Floral Parade in early June
Average climate data for Portland, United States
Month Jan Feb Mar Apr May Jun Jul Aug Sep Oct Nov Dec Year
Average maximum temperature (°C) 8 9 11 15 20 22 27 28 23 17 11 7 28
Average minimum temperature (°C) 2 2 3 4 7 9 11 13 11 7 5 1 1
Average precipitation (mm) 110 82 86 78 45 37 8 10 43 87 89 115 790
Average rainfall days (days) 18 17 21 19 14 11 5 5 10 16 19 18 173
Average snowfall (mm) 23 31 38 0 0 0 0 0 0 0 1 7 101
Average snowfall days (days) 1 2 2 0 0 0 0 0 0 0 0 1 7
Average relative humidity (%) 82 84 80 78 72 70 63 63 69 75 83 82 75
Average wind speed (km/h) 9 9 8 8 7 7 7 6 6 7 9 9 8
Average daily daylight hours (h) 9 10 12 13 14 15 15 14 12 10 9 8 12
Average daily sunshine hours (h) 4 4 5 7 8 9 10 10 9 5 4 4 7
Average cloud coverage (%) 57 57 55 54 45 42 26 22 34 42 55 56 45
Average UV index 2 2 3 3 4 5 6 5 4 3 2 2 3

Minimum and maximum temperatures in Portland

The warmest month, with the highest average maximum temperature, is August (27.6 °C). The month with the lowest average maximum temperature is December (6.8 °C). Overall, the average maximum temperature over the whole year is 16.3 °C.

The month with the highest average minimum temperature is August (12.7 °C). The coldest month, with the lowest average minimum temperature, is December (1.5 °C). Overall, the average minimum temperature over the whole year is 6.3 °C.

Rainfall amount in Portland

The wettest month, with the highest amount of precipitation, is December (114.6 mm). The driest month, with the least amount of precipitation, is July (8.1 mm). Over the whole year there are 789.5 mm of rainfall on average.

Rainfall days in Portland

The month with the most days of rain is March (20.5 days). The month with the fewest days of rain is July (5 days). Over the whole year there are 173.3 days of rain on average.

Snowfall amount in Portland

The month with the most snowfall is March (38.5 mm). The months with the least snowfall are April, May, June, July, August, September and October (0 mm). Over the whole year there are 100.6 mm of snowfall on average.

Snowfall days in Portland

The month with the most days of snowfall is February (2.3 days). The months with the fewest days of snowfall are May and June (0 days). Over the whole year there are 6.6 days of snowfall on average.

Relative humidity in Portland

The month with the highest average relative humidity is February (84.2 %). The month with the lowest average relative humidity is July (63 %). The overall average relative humidity over the whole year is 75.2 %.

Wind speed in Portland

The windiest month, with the highest average wind speed, is January (9.4 km/h). The calmest month, with the lowest average wind speed, is August (6.1 km/h). The overall average wind speed over the whole year is 7.7 km/h.

Cloud coverage in Portland

The month with the cloudiest skies, so the highest cloud coverage, is January (57.4 %). The month with the clearest skies, so the lowest cloud coverage, is August (22.2 %). Over the whole year there is an average cloud coverage of 45.4 %.

Daylight hours and sunshine hours in Portland

The month with the longest days, so the most daylight, is June (Average daylight: 15.1 h). The month with the shortest days, so the least daylight, is December (Average daylight: 8.1 h). Over the whole year there are 11.8 h of daylight per day on average.

The month with the most sunshine per day is August (Average sunshine: 10 h). The month with the least sunshine per day is January (Average sunshine: 3.9 h). Over the whole year there are 6.6 h of sunlight per day on average.

UV index in Portland

The month with the highest average UV index is July (UV index: 6). The months with the lowest average UV index are January, February, November and December (UV index: 2). Over the whole year the average UV index is 3.4.

Was this page helpful?
Feedback