Asia › Japan › Kamakura › Climate

Kamakura climate data

Kamakura enjoys a humid subtropical climate with four distinct seasons, featuring warm, humid, and often rainy summers, and mild, breezy winters. The city is known for its substantial rainfall, lush greenery, and moderate temperatures year-round, making it a popular destination for both cultural sightseeing and beach activities along the scenic Sagami Bay coast.

Best times to travel

The best times to travel section shows how the months compare for a visit, so you can find the time of year that fits what you want to do.

Background colours of the months:
The colour shows the typical temperature: yellow (hot), green (mild) and blue (cold). How strong the colour is shows the travel season: full colour means high season, soft colour means shoulder season and soft-striped means off season.

Weather symbols:
Each month has one symbol showing what the weather is typically like, such as hot and sunny, freezing or a rainy or snowy season. Use them to quickly spot months that match the weather you want, or to avoid the ones that don't.

Crowdedness:
The people icon shows how busy the place usually is. The more people, the more crowded it gets.

Additional notes:
The grey info boxes point out special things worth knowing, like recurring weather issues or seasonal events.

for Kamakura, Japan
☀️
Jan
🌤️
Feb
🌤️
Mar
🌤️
Apr
☀️
May
🌤️
Jun
🌤️
Jul
🔥
Aug
🌤️
Sep
🌤️
Oct
🌤️
Nov
☀️
Dec
High season: April - May, Nov.
Shoulder season: Jan., March, June - Aug., Oct., Dec.
Crowdedness: 8 (Very crowded)
Tap on a month for more info Hover over a month for more info
Weekends and holidays are far busier than weekdays, especially at Kotokuin (Great Buddha), Hasedera and Enoden trains
Rainy season roughly June to mid July; hydrangeas peak mid June at Meigetsuin and Hasedera
Typhoon risk August to October can disrupt Enoden trains and beach days

The climate of Kamakura

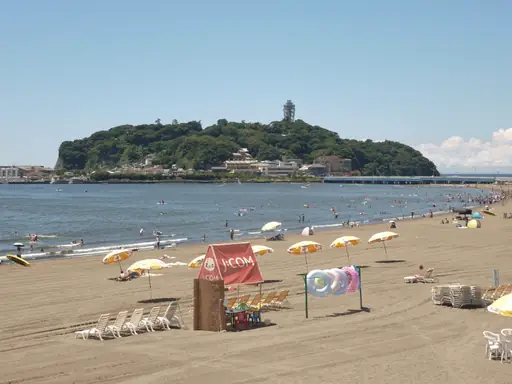
Kamakura’s climate is shaped by its coastal location and surrounding hills, resulting in moderate temperatures and abundant precipitation throughout the year. Summers (June–August) are warm to hot, humid, and often cloudy, with average highs of 28–30°C and lows around 20–25°C. The rainy season, or tsuyu, runs from mid-June to mid-July, bringing heavy rainfall and vibrant hydrangea blooms. Typhoon season extends from June to November, occasionally bringing intense downpours and strong winds, especially in September. Despite the rain, summer is lively, with beachgoers flocking to Sagami Bay and surfers enjoying the waves. Sea temperatures peak at 26–28°C in August, ideal for swimming and water sports.

Winters (December–February) are mild and mostly dry, with average highs of 10–14°C and lows around 3–8°C. Snowfall is rare and usually light, melting quickly. Spring (March–May) and autumn (September–November) are the most pleasant seasons, offering mild temperatures (15–25°C), moderate rainfall, and abundant sunshine. Cherry blossoms bloom in late March to early April, while autumn foliage colours the city from late October to November. Kamakura receives about 1,800 mm of precipitation annually, with the wettest months being June, September, and October. Sunshine is most abundant in spring and autumn, with up to 6 hours per day, while summer tends to be cloudier. Winds are generally moderate, averaging 7–13 km/h, but can be brisk during storms and typhoons.

Average climate data for Kamakura, Japan
Month Jan Feb Mar Apr May Jun Jul Aug Sep Oct Nov Dec Year
Average maximum temperature (°C) 9 10 13 17 22 24 28 30 26 21 17 12 30
Average minimum temperature (°C) 4 5 7 11 16 20 23 25 22 17 12 7 4
Average precipitation (mm) 15 12 30 35 24 41 51 31 36 47 18 13 352
Average rainfall days (days) 7 9 12 13 11 14 15 12 11 11 8 6 130
Average snowfall (mm) 1 3 2 0 0 0 0 0 0 0 0 0 6
Average snowfall days (days) 1 1 0 0 0 0 0 0 0 0 0 0 2
Average relative humidity (%) 60 63 66 69 70 78 79 76 74 72 68 63 70
Average wind speed (km/h) 15 16 17 17 16 14 15 14 15 16 15 15 16
Average water temperature (°C) 17 16 16 18 19 22 25 26 26 23 22 19 21
Average daily daylight hours (h) 10 10 12 13 14 14 14 13 12 11 10 9 12
Average daily sunshine hours (h) 6 5 6 9 9 8 9 10 8 6 6 6 7
Average cloud coverage (%) 29 40 42 41 35 41 37 31 38 42 36 29 37
Average UV index 3 3 4 5 5 6 7 6 5 4 4 3 5

Travel info

  • Spring (March–May): Mild (10–20°C), cherry blossoms late March to early April, moderate rainfall. Ideal for hiking and sightseeing; bring layers and a rain jacket.
  • Summer (June–August): Warm, humid, and rainy (20–30°C), rainy season in June–July, typhoon risk through September. Wear breathable clothing, use sun protection, and carry rain gear. Beaches and surfing are popular.
  • Autumn (September–November): Comfortable (15–25°C), beautiful autumn foliage, moderate to high rainfall, especially in September and October. Great for outdoor activities; pack layers and a rain jacket.
  • Winter (December–February): Mild and mostly dry (3–14°C), rare light snow, many sunny days. Warm layers recommended, but heavy winter gear is rarely needed.
  • Sea swimming is best from July to September, when water temperatures are above 24°C.
  • Rain gear is useful year-round, especially during the rainy and typhoon seasons.
  • UV index is high from May to September; sun protection is essential.
  • Check forecasts for typhoon warnings, especially from June to November.

The best time to visit Kamakura

The best time to visit Kamakura is in late spring (April–June) and early autumn (September–October). These periods offer mild, comfortable temperatures, beautiful cherry blossoms or autumn foliage, and fewer crowds than peak summer. Outdoor activities, temple visits, and beach outings are especially enjoyable during these clear, pleasant months.

The worst time to visit Kamakura

The least favourable time to visit Kamakura is from late June to September, when the city experiences its rainy season, peak summer heat, and high humidity. Typhoons may also occur, bringing heavy rain and possible travel disruptions. Outdoor activities and beach visits can be less enjoyable during this period.

Frequently asked questions

What is the climate like in Kamakura throughout the year?

Kamakura has a humid subtropical climate with warm, humid summers and mild, breezy winters. Rainfall is substantial year-round, especially in June, September, and October. Spring and autumn are mild and pleasant.

When is the rainy season in Kamakura?

The rainy season, or tsuyu, in Kamakura runs from mid-June to mid-July. This period brings frequent heavy rain and lush hydrangea blooms, with June and September being the wettest months.

Does Kamakura get snow in winter?

Snowfall in Kamakura is rare and usually light. When it does snow, it melts quickly due to mild winter temperatures. Most winter days are sunny and dry.

What are the average summer temperatures in Kamakura?

Summer temperatures in Kamakura typically range from 20°C at night to 30°C during the day. Humidity is high, and the season is often cloudy with frequent rainfall.

When is the best time for beach activities in Kamakura?

The best months for swimming and beach activities are July to September, when sea temperatures reach 24–28°C. Earlier and later months are cooler, so swimming is less common.

Is Kamakura affected by typhoons?

Yes, Kamakura can be affected by typhoons from June to November, with September being the peak. Typhoons bring heavy rain and strong winds, so check forecasts during this period.

How much rainfall does Kamakura receive annually?

Kamakura receives about 1,800 mm of precipitation each year, with the wettest months being June, September, and October. Rain gear is recommended for travel year-round.

Minimum and maximum temperatures in Kamakura

The warmest month, with the highest average maximum temperature, is August (29.9 °C). The month with the lowest average maximum temperature is January (9.4 °C). Overall, the average maximum temperature over the whole year is 19.1 °C.

The month with the highest average minimum temperature is August (25.3 °C). The coldest month, with the lowest average minimum temperature, is January (3.8 °C). Overall, the average minimum temperature over the whole year is 14.1 °C.

Water temperature in Kamakura

The month with the highest average water temperature is August (26.3 °C). The month with the lowest average water temperature is February (16.2 °C). Overall, the average water temperature over the whole year is 20.7 °C.

Rainfall amount in Kamakura

The wettest month, with the highest amount of precipitation, is July (51 mm). The driest month, with the least amount of precipitation, is February (11.9 mm). Over the whole year there are 351.6 mm of rainfall on average.

Rainfall days in Kamakura

The month with the most days of rain is July (15.3 days). The month with the fewest days of rain is December (6.1 days). Over the whole year there are 129.6 days of rain on average.

Snowfall amount in Kamakura

The month with the most snowfall is February (3 mm). The months with the least snowfall are April, May, June, July, August, September, October, November and December (0 mm). Over the whole year there are 6 mm of snowfall on average.

Snowfall days in Kamakura

The month with the most days of snowfall is February (1 days). The months with the fewest days of snowfall are May, June, September and November (0 days). Over the whole year there are 2.3 days of snowfall on average.

Relative humidity in Kamakura

The month with the highest average relative humidity is July (79.5 %). The month with the lowest average relative humidity is January (60.4 %). The overall average relative humidity over the whole year is 70 %.

Wind speed in Kamakura

The windiest month, with the highest average wind speed, is April (17.4 km/h). The calmest month, with the lowest average wind speed, is June (14 km/h). The overall average wind speed over the whole year is 15.6 km/h.

Cloud coverage in Kamakura

The month with the cloudiest skies, so the highest cloud coverage, is October (42.2 %). The month with the clearest skies, so the lowest cloud coverage, is January (28.8 %). Over the whole year there is an average cloud coverage of 36.8 %.

Daylight hours and sunshine hours in Kamakura

The month with the longest days, so the most daylight, is June (Average daylight: 14 h). The month with the shortest days, so the least daylight, is December (Average daylight: 9.1 h). Over the whole year there are 11.9 h of daylight per day on average.

The month with the most sunshine per day is August (Average sunshine: 10.1 h). The month with the least sunshine per day is February (Average sunshine: 5.1 h). Over the whole year there are 7.4 h of sunlight per day on average.

UV index in Kamakura

The month with the highest average UV index is July (UV index: 7). The months with the lowest average UV index are January, February and December (UV index: 3). Over the whole year the average UV index is 4.6.

Was this page helpful?
Feedback